Learning Python for Data Analysis

Data is an integral part of many modern businesses. It’s essential for companies to gather, process, and analyze data to optimize their business decisions and understand their customers’ journey. These days, the amount of data can be tremendous, making high-efficiency data analysis critical to compete in today’s market. 

Data analysis is the process of inspecting, transforming, and modeling data to uncover useful information and support decisions with data. Many programming languages can perform data analysis, and the best language depends on your needs and your use case. For many, Python is considered the best choice for analyzing data.

Python can quickly create and manage data structures, allowing you to analyze and manipulate complex data sets. Python also has a massive ecosystem of libraries and tools that can assist in processing data quickly and efficiently. It features simple syntax, making Python easier to learn and understand. While Python is relatively simple to pick up and start using, it’s also very full-featured and flexible. All of these characteristics make Python an excellent choice for data analysis. 

In this piece, we’re going to discuss how to use Python for data analysis, discuss why Python is a great choice for data analysis, and provide examples of real-world Python applications. Understanding Python and its data analytics capabilities can unlock many professional opportunities. Interested in learning more? Continue reading!

How to Use Python for Data Analysis: 3 Use Cases

Working with Python for data analysis requires a broad understanding of the language. If you’re not familiar with Python, check out these Python basics before attempting the use cases below. This will give you a knowledge foundation on which you can layer additional data analysis skills. 

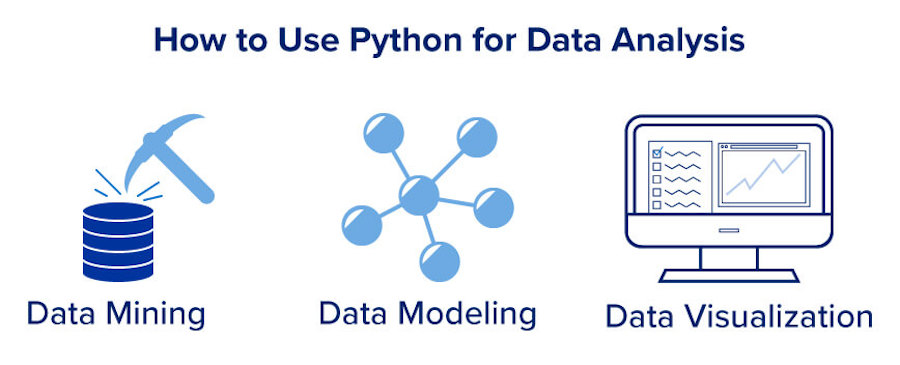
Python can be used for many data-related functions, depending on the type of data you’re working with and what you want to learn from that data. Some of Python’s use cases include data mining, data modeling, and data visualization. Let’s discuss each of these functions and how these use cases can be deployed in the real world. 

Python Data Analysis Use Case 1: Data Mining

Many businesses generate a trove of data that helps them better understand their customers and processes. However, this data isn’t helpful in and of itself. What businesses must do is develop non-intuitive, predictive, and insightful information from this data, which is called data mining. 

Data mining uses data sets to predict likely outcomes given related data set insights and non-intuitive patterns. For example, data mining is particularly valuable for customer journey insights. This information can help businesses understand a person’s likely behavior given certain stimuli, classify customers into different segmentations depending on a variety of attributes, and even help determine factors that can increase the average customer lifetime ROI. 

Python Data Analysis Use Case 2: Data Modeling

Data modeling is a process that helps data scientists define and classify data so that it can be aligned to business hierarchies or other structures necessary for analysis. The goal of data modeling is to produce high quality, consistent, structured data for running business applications and informing decision makers. Python is one of the most helpful tools in data modeling because it is highly scalable, flexible, well-supported, and has a robust user community.. It handles large data sets efficiently and is excellent for data categorization and building hierarchies as well.

In addition, Python libraries (sets of useful code) are robust and constantly growing. By using these libraries, data scientists are able to expedite their modeling as they don’t have to start from scratch on every project. Learning how to use Python libraries is a key skill for aspiring data scientists and analysts alike. 

  • Python Libraries for Data Analysis: Numpy

    Numpy (Numerical Python) is a core library for scientific computing using Python. It’s the perfect tool for identifying scientific data, from basic calculations to advanced functions. This library is a standard for science and engineering, making it an excellent choice for anyone wanting to enter these fields in a data analysis or data science capacity.

    Analyzing data with Numpy is fast and efficient, allowing users to analyze large amounts of data very quickly. The code is clear and easy to write, making the setup simple. It’s also a widely used library with many users and contributors; providing resources to new users and anyone encountering a specific problem. Learning Numpy is a great way to get started as your knowledge expands into your specific areas of interest.

  • Python Libraries for Data Analysis: Pandas

    Pandas is another Python library used for working with data sets. More specifically, it’s a fast, flexible, and high-level tool that is used to manipulate and analyze data, making real-world data analysis much easier.

    Pandas can handle tabular data, taking in information from multiple sources like Excel files, HTML tables, and text files. This enables you to quickly apply the same framework across all of your data to clean and analyze it.

Numpy and Pandas are two important Python libraries to consider, but there is a robust ecosystem of libraries at your disposal. Depending on the type of data you’re using, there are many options that could be the right fit to speed your analysis. If you’re interested in learning more about Python libraries, here is a helpful guide to the top 15 Python libraries for data science

Python Data Analysis Use Case 3: Data Visualization

Data visualization is the discipline of understanding data by displaying it visually, allowing patterns, trends, or correlations to be understood. Python provides many graphing libraries that enable you to display data in many ways depending on your goals and needs. 

Data visualization can help showcase data set trends and features that might not otherwise be obvious. For example, data visualization can help illustrate change over time more effectively than simply looking at a data sheet. 

  • Python Libraries for Data Analysis: Matplotlib

    Matplotlib is a massive and powerful data visualization library available to Python users. It can display data sets using histograms, paths, three-dimensional plots, bar charts, pie charts, and more — data scientists can then choose the best display type to illustrate their specific data set. Matplotlib has a series of in-depth tutorials that anyone can access if they’re interested in learning more about how to effectively use the library.

An image highlighting various uses for python in data analysis

Where to Learn Data Analysis with Python

Learning data analysis with Python can be valuable in a variety of contexts. Aspiring professionals planning to enter a career in data science, business, or computer science can all benefit from knowing Python. It’s also an excellent learning opportunity for those in an existing role who want to add to their current skill set. 

There are many ways to learn Python, and the best option for you depends on your budget, time availability, and your goals. The most common options are coding bootcamps, traditional college degrees, and independent study. 

Bootcamps

Bootcamps provide an opportunity to learn real-world, practical applications for Python in data analysis. They also give you the flexibility to learn on a part-time schedule so that you are able to maintain other professional and personal obligations while still building a valuable data analysis skill set.

Completing a bootcamp provides in-demand, specialized training during a relatively short time period. You’ll be able to work through content via interactive classes taught by instructors who actually work in the field. You’ll also put your newly learned skills to use through collaborative peer-group projects that mirror the workplace environment. 

Bootcamps teach market-driven skills that are in high-demand for data analytics professionals, such as Python, Excel, SQL, and Git/Github, among others. These skills can help prepare you to get started in the field. 

Completing a data analytics bootcamp can prepare you for roles such as data analyst, data scientist, business analyst, and more. According to the U.S. Bureau of Labor Statistics, the median annual wage for data scientists in 2020 was $98,230. Learning data analysis skills can help make you more hireable and command a higher salary as well.

 A bar chart that shows annual wages for data scientists in the United States

A career in data science or data analytics is rewarding, interesting, and well-paying. Prepare to begin a career in data analytics in just 24 weeks with Columbia Engineering Data Analytics Boot Camp.

College Degrees

Traditional undergraduate degree programs take an average of four years to complete and are a great option for those with the time and financial resources to complete them. These programs have the additional benefit of allowing learners to pursue not only their focus discipline, but also to explore other interests during their educational experience.

There are multiple degree options available for anyone wanting to learn Python and data analysis. Computer science, data science, and information science students can take classes that teach Python; helping them to collect, collate, and manipulate data. Many business majors also use data analysis and may choose a minor in computer science, including Python, to enhance their marketability and skill sets. 

Independent Learning Options

Python is used for many different applications, with a huge community of developers creating free education resources available online. Independent learning options are available for anyone interested in learning more about Python and data analysis. Taking some time for self-study can help you decide if learning Python is right for you and your future career path. 

edX has many free courses available for learning Python, data analysis, Numpy, and more. Completing these courses can help you get started with Python and determine if you’re interested in continuing your education. There are also many educational videos available on YouTube for anyone interested in learning more about Python. 

Python’s widespread use means that there are many paid resources available too, including educational books like Python for Data Analysis

Why Learn Python for Data Analysis

Python is considered the gold standard for data analysis across fields like math, business, science, and engineering. This makes learning Python a great choice for anyone interested in entering a new data-focused career or adding to their existing skill set. There are a few characteristics that make Python stand out among programming languages when it comes to analyzing data. 

  • Python is very easy to learn. The language features clear syntax and easy readability, so users can familiarize themselves with the tool pretty quickly. This makes Python an excellent choice for someone who is new to programming. 
  • Python is used across many fields. This means that Python users have access to many specialized libraries that can help them accomplish field-specific tasks. 
  • Python is a very flexible language. It’s possible to build data models, work with data sets, create algorithms to process data, mine data from other sources, or hook into web services to use data.
  • Python has a large community of users. The language’s widespread use means there are a number of developers creating documentation, tools, and other resources for people working with Python. Many of the community-created tools and libraries are completely free, allowing Python developers to augment their capabilities without having to spend additional money. This large community also makes it easier to pick up Python as a new user, as there are always experienced programmers who can help answer any questions you might have. 

R vs. Python for Data Analysis

Python and R are both programming languages used for statistical analysis and data analysis. However, there are areas where each language excels. 

R is a free programming language and software stack used for statistical computing and data graphing. The primary difference between Python and R is their focus. While both languages are open-source with large communities and many tools available to augment their use, R is geared primarily for statistical analysis, while Python uses a more generalized approach that can be applied to more areas. 

Python’s general-purpose nature means it can import and export data in a variety of formats, making it especially useful for web scraping and export functions. This makes Python a great choice for businesses looking to get more insight from their company’s data.

Python Data Analysis Examples

Data analysts use programming tools to mine and analyze large quantities of data and find actionable information from this data. Many careers use data analysis to gain valuable insight into trends and make actionable suggestions using data. Data analysis is important across science, engineering, business, fintech, and other quantitative fields. 

If you’re interested in learning more about how to analyze data using Python, taking a look at this guide on how to become a data analyst can help you get started. Read on to discover two examples of Python data analysis and how the language is used in various ways.

Python Stock Analysis

Analyzing stocks is an important part of the job for many financial analysts and other financial professionals. Stock markets generate a massive amount of financial information that requires careful and deep analysis. Developers and finance professionals use Python in data mining and data modeling activities to identify the best stock trading strategies and discover predictive insights into the condition of specific stocks or markets. 

Python scripts are also used to scrape financial information from services like Yahoo Finance, using this data to calculate important trading indicators such as the moving average (MA) — a financial indicator that identifies the direction of a stock’s price trend. Calculating the short-term and long-term moving average using Python can help finance professionals understand the existing and likely trends to help them make better decisions. 

Python for Financial Analysis

The finance industry is increasingly using Python for general-purpose programming and data analysis functions. It’s widely used in quantitative analysis, which processes large sets of financial data. 

Banks often use Python for financial analysis. Relating to risk processing, which involves analyzing a large amount of consumer financial data. Credit risk refers to the possibility of a bank’s client failing to meet obligations on products like mortgages, credit cards, or other types of loans. Many banks use Python to perform financial analysis to reduce risks and prevent defaults, which improves banking profit margins over time. 

Advance your Data Analysis with Python Today

The role of data across all industries will continue to increase, just as the amount of data generated increases as well. Understanding how to manage and analyze this vast amount of data can help you become more effective in your role and more marketable in the marketplace as well. 

Completing a data analysis bootcamp is a great way to get started on enhancing your skill set and learning Python. Columbia Engineering Data Analytics Boot Camp teaches the in-demand skills, including Python, to take your career to the next level. Get started on building your future today. 

Get Boot Camp Info

Back
Back
Back
Back
Back
Back
Back
Back
Back
0%

Step 1 of 6