Data Mining: The Complete Guide

Data analysts play a vital role in turning raw data into business insights. Top-level analysis sharpens this data, giving it life and importance for both decision makers and stakeholders. For this reason, data professionals seeking to expand their skills should learn about data mining and how to employ it in their work.

Data mining isn’t a new concept — businesses have used it for decades, in various forms, to uncover useful information in the ever-growing cloud of data businesses create. However, simply collecting more data doesn’t always produce sound decisions. In fact, too much data can paralyze decision-making, a challenge known as being “data rich, but information poor.” Data mining helps turn that challenge into possibility and, as a result, its importance only continues to grow.

In this article, we’ll provide a comprehensive overview of data mining, offering insight into a skill that can help advance your career in data science. Specifically, we will cover the following:

What is Data Mining and Why is it Important for Companies?

Data mining addresses the need to shape data into insight. It is the process of analyzing large amounts of data to discern trends, non-intuitive patterns, or even anomalies. Data miners apply a variety of tools and technologies to uncover these findings, and then use them to help businesses make better decisions and forecasts.

Companies derive benefit from data mining in many ways: anticipating demand for products, determining the best ways to incent customer purchases, assessing risk, protecting their business from fraud, and improving their marketing efforts.

Why Companies Are Eager to Use Data Mining

According to SAS, the term “data mining” emerged in the 1990s. The process is also known as “knowledge discovery of databases” and was performed manually before computer-processing power and other technologies made it faster and more efficient.

Every time someone swipes a credit card, clicks on a website, or scans a product in a checkout line, a point of data is created. Each of these data points remain dormant until they can be extracted, compiled, and compared to other points. Companies derive no benefit from data sitting inertly; they must interact with this data to harness the insights it contains, unlocking the value every global business finds that essential.

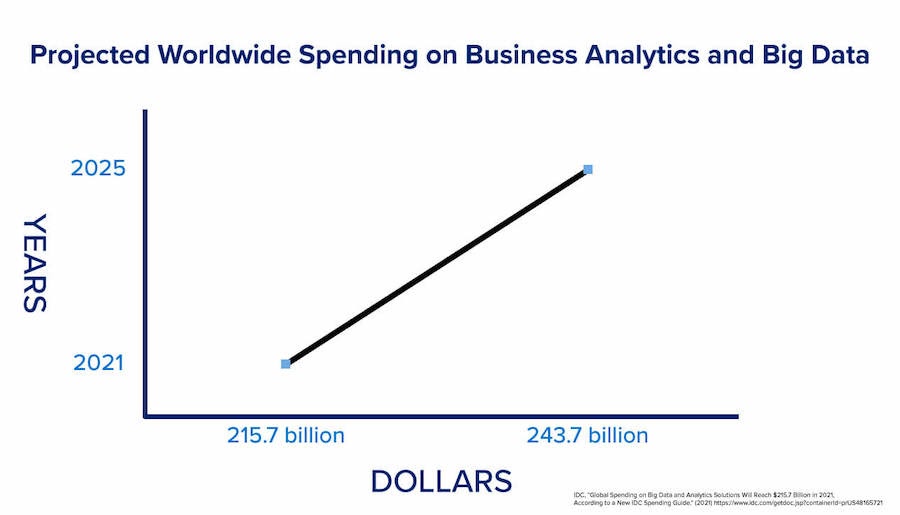
International Data Corporation (IDC) projects worldwide spending on business analytics and big data to reach $215.7 billion in 2021 and further forecasts spending to grow by 12.8% through 2025. In addition, MicroStrategy’s 2020 Global State of Analytics report found that 94 percent of business intelligence and analytics decision makers said data and analytics are important to growth — and more than half say they use data and analytics to drive process, cost efficiency, strategy, and change.

Line graph of projected worldwide spending on business analytics and big data

Data mining is central to this growth in data analytics, and many industries need employees versed in the process, including retail, finance and insurance, communications, healthcare, and many others. Some jobs in which data mining techniques could be important include data analyst, data scientist, software engineer, financial analyst, and business analyst.

Real-World Examples of Data Mining

Examples of data mining are everywhere. Retail companies rely heavily on data mining, especially those that offer reward cards and affinity memberships. Consumers who purchase a particular brand of shampoo, for instance, might receive coupons for other products that fit their personal shopping behavior or products that have similar consumer segments.

Those who shop or consume entertainment online have created a wealth of data to be mined. Surely you have received recommendations for movies to watch or shoes to buy based on your purchases, viewing habits, and web clicks. Your data, and that of billions of other consumers, is mined to generate these “recommended for you” pop-ups.

In addition, financial institutions use data mining to detect fraud, protecting them and their customers. And, healthcare providers are improving treatment methods based on data mining patterns distilled from patient studies and clinical trials.

Want to further your knowledge and gain in-demand skills in the field of data science in as little as 24 weeks? Learn how through Columbia Engineering Data Analytics Boot Camp.

The 6 Stages of the Data Mining Process

Data mining follows an industry-proven process known as CRISP-DM. The Cross-Industry Standard Process for Data Mining is a six-step approach that begins with defining a business objective and ends with deploying the completed data project.

Data mining projects begin with business understanding — with companies determining their objectives for a project. Which data does the company wish to study? What are the goals of that study? What problems does the project seek to solve, or what opportunity does it seek to pursue? This stage is essential to determine the right datasets to be analyzed. As a result, data analysts should have a clear understanding of their company’s mission, strategy, and objective needs.

With a stated objective, the data mining project moves to the next phase: defining the data. In this step, analysts gather data, describe it (the amount, whether it includes numbers and strings, how it’s coded, etc.), and verify its quality. Some key questions for this step: Are there any data gaps? Does the data contain errors? Are fields coded correctly? Is any data duplicated?

It’s important to note that not every data point a company stores will fit every project. Gathering the proper data will save time as well as ensure the quality and applicability of insights derived during the project.

Data preparation is often the most time-consuming step of a mining project. In fact, according to IBM, data preparation can consume 50-70% of a project’s time and effort. Data preparation involves selecting, cleaning, sorting, and formatting the data to be studied. In addition, data from multiple sources will need to be merged or adjusted, and new data may need to be constructed. Once the data has been thoroughly reviewed and prepared, it is ready to be studied.

In the modeling stage, data analysts and scientists employ many types of modeling techniques (which we’ll explore later) to uncover insights. Perhaps they will run models to find patterns or anomalies. For example, they may run a predictive model to learn whether past data can determine a future outcome. Or, they may run association rule mining (via machine learning models) to discover non-intuitive patterns that provide valuable insights analysts didn’t even know were there. It’s important to realize that analysts often run multiple models on the same set of data, depending on the project’s goals and requirements.

In the evaluation stage, analysts assess whether results answer the business understanding questions properly, meet the project’s objectives, or uncover any unexpected patterns. They will also assess whether the correct models were used.

If the initial objective is unmet — or new questions arise — data analysts will return to the modeling phase. In addition the data may need to be adjusted as well. Once the data results answer the business understanding questions, the project reaches its final stage.

In the deployment stage, data analysts report their findings and recommend a plan to make those insights actionable. Perhaps the data mining project found that retail customers buy mayonnaise frequently when buying air freshener — a completely non-intuitive insight. With this information, the retailer can craft a marketing plan to take advantage of this insight from a promotional and floor plan perspective.

Which Data Mining Tools to Master

Now that you understand the CRISP-DM process, let’s cover some of the top data mining tools and technologies analysts use. Many tools are available, and those who work in data science and analytics likely are familiar with many of these.

Python consistently ranks among the world’s most-used and most-wanted programming languages, according to Stack Overflow. As an object-oriented language with an easy-to-learn syntax, Python has many uses. Developers create websites and games with Python, and AI programmers build training models with it. In addition, data scientists use Python frequently for data mining and analytics.

Python’s vast collection of mathematical and scientific libraries and modules help make the language a data mining powerhouse. Pandas, Numpy, and Matplotlib are just three of the libraries available that Python users employ in data mining projects. Python’s website lists a host of companies that rely on the language, including the HR platform Gusto. This business platform says Python’s databases “allow for quick and painless development of data mining tools.” If you’re interested, consider learning Python at a data analytics bootcamp.

R, like Python, is a popular language used in data analytics. R’s programming environment centers on “data manipulation, calculation, and graphical display” — all key elements of data mining.

Data analysts use R to perform several data mining techniques such as classification and clustering, as well as visualization of results. R, which is free and open-source, delivers more than 18,000 companion packages, including dozens that involve data mining.

Tableau is one of the world’s leading business intelligence platforms, according to Gartner, and companies use it widely to assess, analyze, and communicate data insights.

Tableau offers both free and paid versions of its platform, into which users can import data from simple spreadsheets or massive data warehouses. Tableau also gives users the ability to uncover data patterns or trends (a key pursuit of mining) and visualize their findings.

With Tableau, analysts aren’t required to learn how to use programming languages such as Python and R to perform a data mining project. Charles Schwab, Honeywell, Red Hat, and Whole Foods are among the many companies that use Tableau. And Tableau Public, the platform’s free online version, enables anyone to create data visualizations.

Aspiring data miners can learn to use Tableau for business intelligence at Columbia Engineering Data Analytics Boot Camp.

SAS, an analytics software company, offers multiple platforms for data mining that users with limited statistical or programming skills can employ. The SAS Enterprise Miner platform’s process flow addresses each step of the CRISP-DM process and is scalable from single users to large enterprises.

SAS also sells products for AI and machine learning, data management, cloud computing, and more. Users can access a range of training resources, even including some live classes.

Apache Hadoop is an open-source framework for storing and processing significant amounts of data. Those who work with big data understand the challenges of working with the scale, and types, of data generated. The Hadoop framework makes storing, accessing, and analyzing data faster and easier. Many corporations, such as Facebook, Chevron, eBay, and LinkedIn consider Hadoop integral to their data strategies.

Apache Spark, part of the Hadoop ecosystem, was developed to update Hadoop’s MapReduce function for processing data. According to InfoWorld, Spark has become a big player in the world of big data and machine learning.

Spark’s primary benefit is its speed — the platform can run Hadoop workloads much faster than in the conventional framework. Spark also includes libraries for working with Structured Query Language (SQL) in databases and machine learning, among others. More than 100 companies and organizations use Spark for their big data projects.

RapidMiner is a platform that automates many data analytics tasks. The RapidMiner Studio offers an API with various user-friendly features: a visual interface with drag-and-drop capabilities, a modeling library of more than 1,500 algorithms and functions, and templates for assessing customer churn, performing predictive analyses, and detecting fraud.

As with similar platforms, users can connect most data sources, including in-house databases, to RapidMiner and query data without writing complex SQL code. RapidMiner also provides tools for preparing and visualizing data,one of the most time-consuming components of data mining projects.

IBM’s SPSS Modeler is a visual data science and machine learning framework designed to help data scientists work more quickly. It employs more than 40 algorithms for data analysis, can be used with multiple data sources (including Hadoop and cloud-based environments), and integrates with Apache Spark.

The SPSS Modeler also integrates with programming languages such as Python and R, and has a large statistics library, as well as an extensive collection of videos and learning tutorials.

To advance your career, consider applying to Columbia Engineering Data Analytics Boot Camp to learn the latest technical skills in data science.

What Are the Most Commonly Used Data Mining Techniques?

Data scientists employ different ways to store and query data, as well as a variety of models to analyze it. The techniques and terminology are plentiful, and aspiring data analysts must be familiar with them.

Machine Learning

Data mining and machine learning share some characteristics in that both fall under the data science umbrella; however, they are important differences.

While data mining is the process of extracting information from data, machine learning is the process of teaching computers the process of data analysis. Specifically, data scientists develop algorithms to teach computers to perform many of the data mining processes that companies require; increasing both efficiency and the volume of analysis that can be completed.

Machine learning often is used as a component of data mining. Many companies use machine learning to perform multi-attribute segmentation analysis on their customer base. Streaming services, for example, can use machine learning to sift through users’ viewing habits and recommend new genres or programs they might like. The better the algorithm, the more accurate and detailed those recommendations can be.

Machine learning is one of the advanced topics of Columbia Engineering Data Analytics Boot Camp, which covers the technical and practical skills needed to pursue a career in data analytics.

Data Visualization

The best data mining projects can produce the sharpest and most useful insights. But if they remain static numbers on a page, they’re worthless to decision-makers.

Data visualization allows analysts to share their discoveries through charts, graphs, scatterplots, heat maps, spiral graphics, flow charts, and more. These visualizations can be static or interactive and, most importantly, they can effectively convey critical insights needed to make key business decisions.

In addition, several of the tools listed above offer visualization platforms, which means team members who cannot code can still create data visualizations; however, many data scientists learn HTML/CSS or JavaScript to boost their visualization skills.

Data visualization is a major part of Columbia Engineering Data Analytics Boot Camp — in fact, the fourth module is devoted to it. Learners go in-depth in visualization, which is key to making insights actionable.

Statistical Techniques

Data mining applies various statistical methods to analyze large data sets, and data mining platforms (such as those discussed above) can make data mining easier. However, learning data mining statistical techniques provides analysts with greater understanding of the work they do and how to do it more effectively.

Some statistical techniques include regression, classification, resampling (utilizing multiple samples from the same data set), and support-vector machines (an algorithmic subset of classification).

Statistical modeling and forecasting are key elements of the introductory module to Columbia Engineering Data Analytics Boot Camp.

Association

Data analysts apply the association rule to find relationships in non-intuitive data patterns and understand what business value is associated with those patterns, if any.

Transaction analysis is a common form of association. Retailers scan an aggregation of many customers’ shopping trips, looking across many transactions to find patterns. While the analysis will highlight patterns you might expect to find (e.g., peanut butter and jelly, mayonnaise and bread), association also uncovers patterns that indicate non-intuitive relationships such as coffee creamer and air freshner. A deeper dive is then conducted on these identified associative patterns, and they are either validated and passed on as insights (e.g., the coffee creamer/air freshener pattern occurs due to seasonal items such as gingerbread creamer and balsam pine air freshener) or discarded as anomalies (e.g., coincidentally coinciding promotional schedules putting two items frequently on sale at the same time).

Classification

The classification technique looks at the attributes associated with a dataset where a certain outcome was common (e.g., customers who received and redeemed a certain discount). It then looks for those common attributes across a broader dataset to determine which data points are likely to mirror that outcome (e.g., which customers will be likely to redeem a certain discount if it is given to them). Classification models can help businesses budget more effectively, make better business decisions, and more accurately estimate return on investment (ROI).

Decision trees, a subset of machine learning, are algorithms used when running classification or regression models in data mining. The algorithm can ask simple yes or no questions of data points to classify them into groups and lead to helpful insights. For example, a decision tree may be used by financial institutions to pinpoint successful loan eligibility based on relevant categorical data like income threshold, account tenure, percentage of credit utilized, and credit score.

Clustering

With clustering, data miners identify and create groups in a dataset based on similar characteristics. The process divides the data into subsets, or clusters, for analysis. Doing so provides for more informed decision-making based on targeted collections of data.

Analysts use several types of clustering techniques. They employ the partitioning method, for instance, to divide data into clusters to be analyzed separately. The K-Means algorithm is a popular method of partitional clustering. This algorithm works by first allowing the user to select a number of K-clusters to be used as centroids (or central points) or iterations through which the algorithm will run. Then, objects closest to these points are grouped to form “K number of clusters,” and with each iteration, the centroid distance for each cluster shifts and is updated accordingly. This process is repeated until there are no more changes in the centroid distance for each cluster — or until each iteration is fulfilled. A fun way to use the K-Means algorithm in partition clustering is to look for underutilized/undiscovered players when choosing a fantasy football team. The algorithm can use a superstar player’s stats as the centroids, and then run through iterations identifying clusters of attributes or players (by attribute).

Conversely, in the hierarchical method, individual data points are viewed as a single cluster, which then can be grouped based on their similarities. A dendrogram is one practical example of the hierarchical method; it is a tree-like network structure consisting of interconnected data points, or nodes, used to show taxonomic relationships. Dendrograms are a common visualization technique for displaying hierarchical clusters. In our fantasy football example, a dendrogram might be used to visualize the process by which we selected or passed on player choices, based on our evaluation and desired attributes.

Data Cleaning and Preparation

According to Forbes, one of the major problems in data analytics is bad data. That’s why data cleaning and preparation are so important.

This process focuses on acquiring the right data and making sure it’s accurate and consistent. Errors, formatting differences, and unexpected null sets can inhibit the mining process.

Stages of data cleaning include verifying the data is properly formatted, deleting unnecessary or irrelevant data, removing duplicate sets, and correcting simple issues such as input errors. Even the best algorithm won’t work with incomplete or corrupted data.

Data Warehousing

Businesses that produce products need accessible, secure, organized locations in which to store them for distribution. The same applies to their data.

Businesses that create a significant amount of data must collect and store it properly to analyze it properly. Data warehousing is a three-stage process commonly known as ETL, which stands for extract, transform and load. Data is extracted from its source to a staging area, where it is transformed (or cleaned) and validated. Then it is loaded into the data warehouse.

Proper warehousing is vital for businesses that generate a large volume of data, particularly regarding customers. By properly storing all this data, businesses can mine it for patterns and trends more easily.

Outlier Detection

Most data mining techniques look for patterns in data. Outlier detection seeks to find instances that stand out as unique.

This process looks for data that conflicts with the rest of a set. This can include errors (perhaps some data was input incorrectly) or data that provides unique business insights. Analysts can test for numeric outliers, perform a DBScan (which identifies noise points), or isolate anomalies in a large dataset (an isolation forest).

Outlier detection can help businesses understand unique purchases (a run on bathing suits in winter, for instance), detect fraudulent transactions, and improve the logistical flow of the production process.

Prediction

Prediction is a fundamental pursuit of data mining. Businesses use predictive modeling to answer the question, “What’s going to happen next?”

Predictive models find patterns in data, then use those patterns to create forecasts. The forecasts can include consumer spending habits, inventory needs for a supplier, sites people might visit based on their internet usage, or a baseball team’s projected strikeout rate against an upcoming pitcher.

Several types of predictive models are available. Forecast modeling seeks to answer a specific question. For example, how many SUVs should a car dealer have on the lot next month? Time-series modeling analyzes data based on its input date — such as product sales over a particular year that may assist in year-over-year sales forecasting.

Regression

Regression is used in data mining to analyze relationships between variables as part of the predictive modeling process. It can be used to project sales, profits, required product volume, weather data, and even patient recovery rates for medical providers. Analysts primarily employ two regression models. Linear regression estimates the relationship between two variables. For instance, a social researcher might study the relationship between a person’s home location and overall happiness, employing regression analysis to determine if there is a linear relationship between those two variables. Linear regression could also be used to predict housing prices in a real estate market where homes are generally increasing in size and structure. In this case, one variable (changes in home size and structure) is analyzed in relation to another (subsequent shifts in price).

Multiple regression, on the other hand, explains the relationship among multiple variables or data points. For example, when analyzing medical data points like blood pressure or cholesterol levels, analysts may use multiple regression models to explore related variables like height, age, and time spent on aerobic exercise in a given week.

In a regression model, decision trees can also be used to diagram results determining the probability of a specific outcome within two results. Consider this example: A company has a set of data that identifies customers as male or female and by their age. With a decision tree algorithm, it can ask a series of questions (“Is the customer a female?” and “Is the customer younger than 35?”) and group the results accordingly. This is a common tool in marketing strategy to target potential customers based on demographics.

Sequential Patterns

Sequential pattern mining looks for events that frequently occur in data. The process is similar to the association rule in that it seeks to find relationships, but these form an ordered pattern.

One example is shopping patterns. Retailers often place products near each other because customers often shop in sequences ((think of breakfast foods such as cereal, oatmeal, and granola bars in the same aisle). Another example is targeting internet advertising based on a browser’s click sequence. By using sequential pattern mining, businesses can make forecasts based on the results.

Tracking Patterns

The process of pattern tracking is fundamental to data mining. Essentially, analysts monitor trends and patterns in data associated with the progression of time, allowing them to forecast potential time-sensitive outcomes.

This is important for businesses to understand how, when, and how often their products are being purchased. For example, a sports equipment manufacturer tracks the seasonal sales of baseball gear, soccer balls, or snowboards and can choose times for restocking or marketing programs. In addition, a local retailer in a vacation destination might track buying patterns before a holiday weekend to determine how much sunscreen and bottled water to stock.

In-Demand Skills To Enhance Your Data Analytics Experience

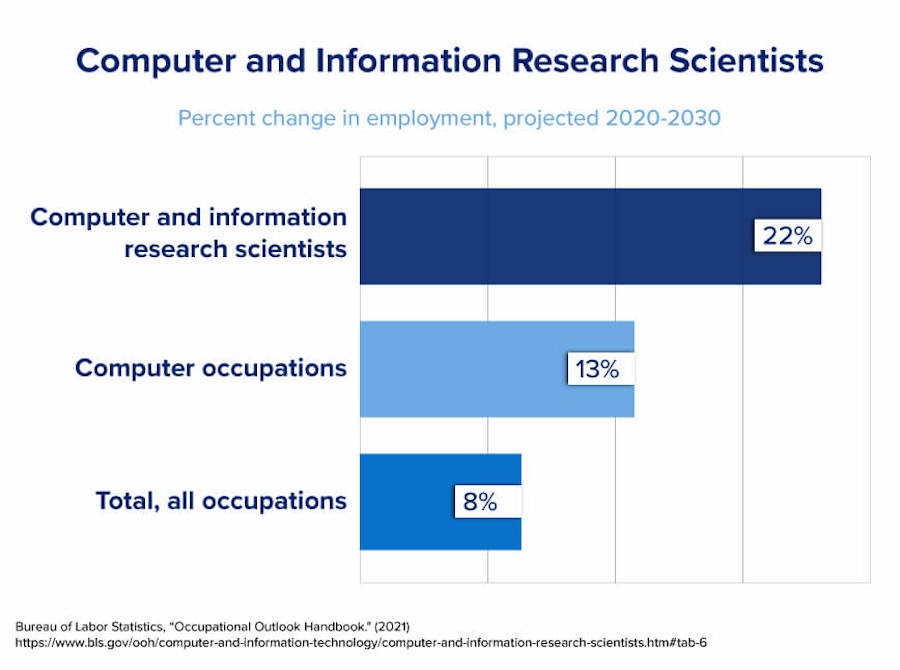
According to the U.S. Bureau of Labor Statistics, the computer and information research science industry — which encapsulates data analytics — is expected to grow by 22 percent by 2030. Data mining is one skill that can boost your employability within this field. Here are a few other in-demand skills — all of which are part of Columbia Engineering Data Analytics Boot Camp:

  • Microsoft Excel: It’s far more than a spreadsheet. Analysts can perform VBA scripting, statistical modeling, and forecasting using Excel, which is still a powerhouse in the data world.
  • Python tools: Libraries such as NumPy, Pandas, Matplotlib, and Beautiful Soup contribute significantly to Python’s importance in data science.
  • Working with databases: Consider learning to program in SQL, NoSQL, and MySQL; as well as how to work with frameworks such as MongoDB to become proficient with databases.
  • Visualization techniques: Decision-makers appreciate data that is not only actionable but also accessible and visually compelling. Make your data come alive by learning how to visualize it with HTML/CSS, JavaScript, and other solutions.

An image that highlights the projected employment growth of computer and research scientists through 2030.

Companies demand more than data — they need skilled professionals who understand how to turn data into business success. You can build a fascinating career and help shape the future by becoming proficient in data mining and other analytic techniques.

If you’re ready to expand your career, consider enrolling in Columbia Engineering Data Analytics Boot Camp. In this rigorous 24-week course, you will learn the technical and practical foundational skills needed to begin or further a career in data science.

Get Boot Camp Info

Back
Back
Back
Back
Back
Back
Back
Back
Back
0%

Step 1 of 6