18 Data Analytics Tools You Need to Improve Your Skills

If you trade stocks, distribute and sell products, or develop marketing strategies, you likely understand the power of data. Today’s data shapes nearly every decision we make and can determine a company’s path to success.

We swim in data (2.5 quintillion bytes are created daily, according to some estimates), and we are constantly developing faster and more automated ways to collect, organize, store, clean, retrieve, and analyze all of it. Thus, keeping current with all the data analytics languages, frameworks, and tools can be overwhelming.

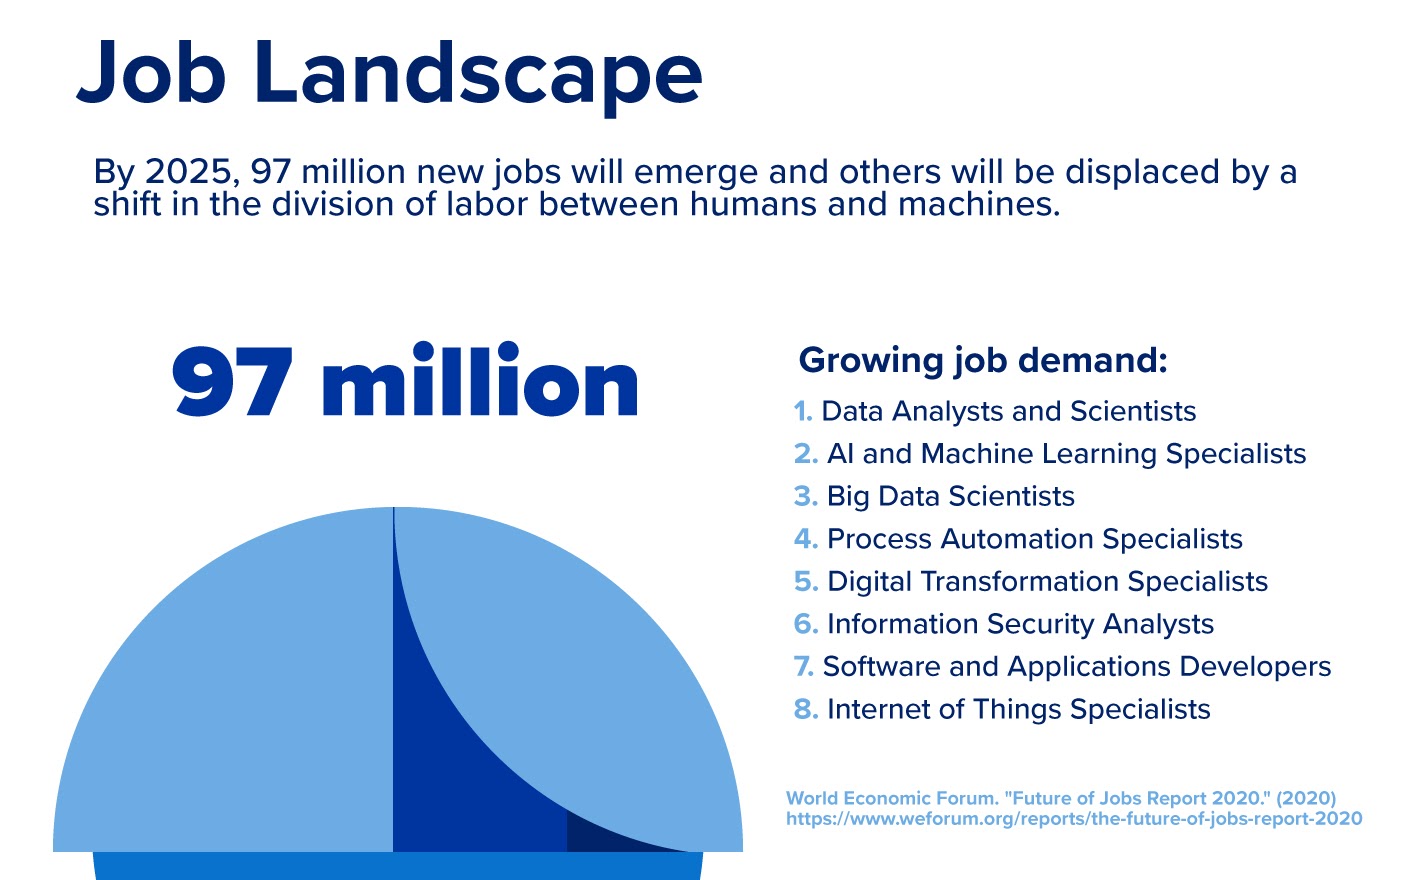
Data analytics usually requires an ever-expanding vocabulary and resume to remain competitive, and it’s a field that needs more data experts. According to the World Economic Forum, nearly all of the top 20 emerging jobs deal with data. In fact, the top three jobs are data analyst/scientist, AI and machine learning specialist, and big data specialist. Further, careers in data can be lucrative. For instance, data scientists earn a mean salary of $103,930 in the U.S., according to the Bureau of Labor Statistics, with several states (including New York) offering mean salaries above $120,000.

Ready to boost your data analytics skills? Then join us in learning about the top data analytics tools that may benefit you in the future.

How Do I Choose Which Data Analytics Tools to Learn?

The World Economic Forum’s 2020 Future of Jobs report indicates that more than 90 percent of organizations in digital communications, education, financial services, transportation, and mining and minerals will adopt big data analytics technologies by 2025. At least 80 percent of companies in agriculture and food production, automobile production, healthcare, and oil and gas production are doing so as well.

Graphic detailing the job landscape in data analytics

These employers are usually looking for professionals versed in big data tech, but where do you start? Perhaps you work for a business, have a strong product to sell, and understand your customer base well. You may work with data daily, have a good feel for using it to make business decisions, and know how it can build success.

But there’s a catch: the sheer amount of data — and ways to store, analyze, and visualize it — can be overwhelming. Data analytics tools change and adapt. Developers make them faster, add more features, and build them to handle ever-growing amounts of data. Choosing the right tool is like choosing the right road to your destination quickly and easily. But which one?

That’s where you have to be selective. You can’t (and probably don’t want to) learn how to use every programming language, framework, or tool for data analytics. What’s important is to gain the skills you need to make yourself more competitive in the job market.

Consider which data analytics skills you need for specific career paths. For instance, the Initiative for Analytics and Data Science Standards analyzed LinkedIn job listings to determine the skills most requested among employers. Here are some of the findings:

Python appeared on 80 percent of job postings for data scientists.

SQL appeared on 100 percent of individual profile listings among data engineers.

SQL appeared on 73 percent of job postings for data analysts.

Many data analytics tools can make you more valuable and in-demand for potential employers. Seek out those that are most important to your field. Professionals who work with databases should consider learning SQL and its variations. Python is powerful for data scientists and analysts. JavaScript and Tableau are used for data visualization. And Excel remains an important all-purpose tool.

By combining mastery of these important skills with your business experience and expertise, your research and communication skills, and your professional network, you can make yourself a leading contender in the job market. So which data analytics skills should you consider learning? Here are our picks.

18 Essential Data Analytics Tools You Should Master

The top tools, frameworks, and languages used in data analytics today cover a variety of business needs and technological approaches. Some require little programming experience to operate, while others take time, study, and practice to master.

Again, don’t feel compelled to add every one of these to your resume. Even veteran programmers don’t have the time or energy to become fluent in every data analytics tool. Consider those that best fit your industry, your professional needs, and your job title.

Python 3

Python 3 is the latest version of one of the most popular programming languages in the world. For the fifth consecutive year, Python ranked as one of the most-used languages and as the language developers most wanted to learn, according to the latest Stack Overflow survey.

Python is considered powerful, easy to learn, and usable for a variety of programming purposes. Developers build games and websites with Python, businesses use it for data mining and analytics, and AI programmers train computers to learn with Python. One of the world’s largest film companies runs on Python as well.

Python is important to data analytics and fields that use machine learning because it comes with a robust set of libraries. Users employ Python to shape large amounts of data into real-time analytics and vital projections. For instance, Forecastwatch.com uses Python to help weather services use data to provide more accurate forecasts.

A host of online resources are available to learn Python, which counts millions of users in its community. Someone is usually available to help with tips and troubleshooting. Python’s website is a great place to start, even for coding beginners. And if you’re starting from square one, consider the online resource “Python From the Very Beginning.”

JavaScript

JavaScript is known best as a scripting language for web pages. It makes sites come alive by adding interactive elements such as animation, buttons and menus, and forms for surveys or data entry. JavaScript is ubiquitous in web design — developers have made it the most-used language for nine straight years, according to Stack Overflow.

JavaScript carries versatility beyond building web pages. It is used in game development, APIs, and in apps that work with databases. Data analysts who want to query customers can use JavaScript to build survey apps that gather information. No wonder Hack Reactor calls JavaScript “the best coding language to learn.”

Mozilla, whose co-founder Brendan Eich developed JavaScript, has a wealth of information for beginners about the programming language.

HTML

Hypertext Markup Language, or HTML, is “the most basic building block of the Web,” according to Mozilla’s developers’ site. HTML is one of the primary languages used to create the look and usability of websites.

Developers use HTML on the front end of websites, meaning their code produces the structure of the elements that appear on the page: text, images, hyperlinks — all the content flows through HTML.

HTML remains a foundational tool of web development. According to Stack Overflow, it ranks No. 2 among the most-used technologies for developers. The main reason is its importance to creating web pages, all of which are written in the language.

Visualization is a vital tool for data analysts, who want their information and analysis to be easy and clean to read for fellow team members. Co-workers who don’t understand code certainly can read a web page presentation of your data. This makes HTML a beneficial skill for analysts who want to deliver actionable information.

Mozilla offers a useful, step-by-step introduction to HTML, which includes getting started, key terminology, and how to build your first web page.

CSS

CSS, or Cascading Style Sheets, a companion to HTML, gives your web pages a spark. Consider HTML to be the language that builds the substance of your page and CSS brings style to that substance.

With CSS, developers define the look and feel of their page. Type sizes and fonts, color, column width and spacing, page layout, and design all are controlled with CSS. This language works in conjunction with HTML, so once you’re comfortable with the basics of HTML, you can add CSS to your repertoire. Knowing CSS will enable you to add style and dynamism to your data visualizations.

Getting started is easy. Mozilla offers another easy-to-follow introduction to CSS. In addition, Freecodecamp has built a series of courses that detail how to construct a webpage using HTML and CSS.

Excel

Microsoft’s spreadsheet remains one of the most powerful and usable tools when working with data. Excel’s industry clout is proven. Want proof? The first module of Columbia Engineering Data Analytics Boot Camp includes Excel.

Excel can accomplish far more than creating simple spreadsheets and pie charts. It can be used for statistical modeling and forecasting. Further, Excel offers an array of advanced tools that data analysts, financial analysts, and market analysts can learn to make themselves stand out to employers. Many businesses, large and small, rely on Excel. One example Microsoft highlights includes an ice-cream maker that runs many aspects of its business using Excel.

The jobs site TestGorilla offers this handy look at the expert Excel skills employers are seeking. In addition, Microsoft offers a certification exam in Excel to demonstrate your proficiency.

Tableau

“Data culture” is a key phrase at Tableau, which built its platform to give people and businesses the power to harness their data.

Tableau makes free and paid versions of its software, which can import, analyze, and visualize data from almost any source. Users can input data from spreadsheets, databases, or data warehouses. They can combine data from multiple sources, build visual representations, and discover trends.

Tableau is an option for analysts who must work with data but don’t have the time or interest to learn to code. The Tableau community counts more than one million users, and Salesforce acquired the company in 2019. According to Tableau, Verizon, New York City Health & Hospitals, Whole Foods, and Nissan all use the software.

Tableau Public is a free online platform that allows users to create and share data visualizations.

ETL

ETL isn’t a language, tool, or framework of data analytics. It’s more of a concept — one with which many of the tools listed here can help.

ETL stands for extract, transform, and load; three key interactions required when working with data. Users extract data from a source (such as a database) or multiple sources. Then, they transform the data into a format in which it can be analyzed and loaded into a storage system, such as a data warehouse.

Companies have used the ETL concept since the 1970s, according to SAS, as a way to bring together data from various sources. Though sources have expanded over the decades, ETL remains an important method to consolidate and analyze data, provide historical context to a company’s data, and integrate data. It’s also important for migrating data between systems with different formats.

SAS’s guide to ETL and why it matters is worth exploring to understand how this decades-old concept remains indispensable today.

MongoDB

Those who work with document databases likely are familiar with MongoDB, which is one of the most popular database platforms on the market.

In data parlance, a document consists of a field and a value. Consider the construct, “Name: Joe, Age: 21.” The terms “name” and “age” are the fields, followed by their corresponding values. MongoDB’s storage system makes large documents easy to access, index, and query to find information quickly.

MongoDB hosts a free platform that works with multiple programming languages and can be scaled to large projects. Adobe, eBay, Google, Intuit, and eHarmony are among the companies that employ MongoDB.

The best place to learn how to use and get the most out of MongoDB is the company’s site. MongoDB offers a series of free courses to help set up and query a database, use charts, and do much more. MongoDB also offers professional certifications.

Bootstrap

Websites must be usable, or “responsive,” on all kinds of devices and screen sizes these days. Bootstrap bills itself as the “world’s most popular framework” for building such sites.

Bootstrap is free and open-source, making it available to anyone. It uses CSS and JavaScript components to help users build sites quickly and easily. You can download source code, prebuilt components, and JavaScript plugins to blunt the need to become a coding master. Bootstrap also includes a selection of site themes for purchase that help amateur developers build websites from templates.

A key element of Bootstrap is its ability to help design mobile-first websites, a must for any business. Such sites also can help data analysts reach more stakeholders through mobile visualizations.

Matplotlib

Python’s wide array of libraries helps to make it one of the top programming languages. Matplotlib is a Python library used to create a variety of data visualizations, including animations and those with interactivity.

Matplotlib is free,open-source, and contains code for dozens of visualization formats — from simple line and bar graphs to various style sheets to animations, Matplotlib can display data in myriad ways. Installation instructions are simple, there are multiple tutorials, and third-party packages add even more functionality.

For Python users, Matplotlib is an important companion to visualize data properly.

PostgreSQL/pgAdmin

SQL is a foundational programming language used to store and retrieve data from relational databases. It is considered a high-priority skill among those who work with relational databases. Fortunately, several SQL-based management systems are available to facilitate the process. PostgreSQL is among the most popular databases (No. 2, according to Stack Overflow), and pgAdmin is a key developmental platform that works in conjunction with it.

Pie chart of PostgreSQL popular databases

PostgreSQL is an open-source relational database system that was developed at the University of California at Berkeley in the 1980s. This feature-rich system allows users to define data types, scale their datasets to any size, and write code from different programming languages without recompiling. Apple, Instagram, Reddit, and IMDb are among the many companies that use PostgreSQL. It has become an essential database system.

To make the most of PostgreSQL, tools such as pgAdmin are critical. pgAdmin is a management and administration tool that works on many major web browsers. It can be deployed in a server environment, allowing multiple users access to creating, viewing, and editing all common PostgreSQL objects.

Hadoop

The term “big data” refers to the growing amount and types of data we produce, as well as  the speed with which we produce it. Storing all this data in conventional databases became unwieldy and Hadoop helped to change that.

Hadoop is an open-source framework that provides for storing and processing huge amounts of data. It consists of four core modules: a distributed file system (HDFS) that stores and backs up data on multiple computers; MapReduce, a framework that processes the data; YARN (Yet Another Resource Negotiator), which manages resources and processes job requests; and Hadoop Common, which houses the accompanying libraries and utilities.

According to Amazon Web Services (AWS), Hadoop “makes it easier to use all the storage and processing capacity in cluster servers, and to execute distributed processes against huge amounts of data.” As its usage has grown, Hadoop has broadened its ecosystem to include a variety of tools and applications that collect, store, process, and analyze big data. 

Some of the biggest players in big data — including Facebook, Netflix, and eBay — use Hadoop for their analytics tools, such as recommendation systems. If you’re working in big data, you’re familiar with Hadoop. And boot camps often will include Hadoop as part of their curricula.

NumPy

Python is considered a powerful data analytics tool in part because of its associated  libraries. Among these libraries is NumPy (Numerical Python), another open-source project that bills itself as the “universal standard for working with numerical data in Python.”

NumPy is a Python library devoted to science and engineering. NumPy terminology can get pretty deep (the ndarray object is central to it), but that’s the target user base. NumPy speeds the process of working with arrays and works with other Python libraries, such as Matplotlib for visualization. It is central to data science and machine learning, containing a robust set of tutorials and guides for those who want to employ it for those purposes.

Apache Spark

Apache Spark is a big data solution widely used among companies that deal in high-volume data. It is part of the Hadoop ecosystem, created to bridge some limitations in Hadoop’s MapReduce function.

Apache Spark speeds the time required to perform query and analytical tasks. It includes libraries for use with SQL interactive queries, machine learning, and graph processing. And it operates with multiple data sources in addition to Hadoop.

How is Spark used? According to AWS, Zillow employs Spark to calculate estimated market values of homes, and Yelp uses it to train machine learning models regarding user engagement with specific ads.

R

R joins Python on the list of the most popular programming languages in data analytics. R is used extensively in statistical computing to perform a variety of tasks, including modeling, classification, and clustering. As an important companion to its statistical analyses, R features a graphics environment for visualizing and graphing data.

As a popular open-source language, R is rich with packages — more than 18,000 of them, according to the Comprehensive R Archive Network. They help make R an industry must-have for data analytics.

R’s website is filled with tutorials to get the most out of the programming language, which can be applied to multiple scientific disciplines that use data. For instance, companies such as Merck and Pfizer that recruit Ph.D. students often look for those with knowledge of statistics and programming, according to the Association for Psychological Science. Being able to program in R can open doors.

Microsoft Power BI

Business intelligence software helps companies make key decisions based on their past and present data. Microsoft Power BI is among the most popular platforms for modeling and visualizing data, creating reports and dashboards, and delivering the information leaders need to shape their strategic actions.

Gartner, a global research and advisory company, rates Power BI highly as being a leading and visionary product in the business intelligence market. The platform is scalable, making it usable by small businesses and large global organizations, and works with any dataset. It also incorporates Microsoft’s large suite of products, including Excel and Office. Companies that use Power BI include HP, Nokia, Nestle, and Rolls Royce.

SAS

SAS is one of the world’s leading analytics companies, offering a host of products for a variety of needs, industries, and technologies. SAS sells products for data management, cloud computing, AI and machine learning, marketing, risk management, and much more.

One of SAS’s top products is Viya, a data-management solution that uses AI to help deliver business analysis and transform data into insight. For those using its products, SAS offers a deep collection of training tools and resources, including live classes, webinars, video tutorials, and guides.

Splunk

Splunk calls itself the world’s first “Data to Everything” platform and even has trademarked the phrase. More than 90 Fortune 100 firms use Splunk products, and the company offers more than 2,000 applications.

Splunk’s suite of products is used in IT, DevOps, and information security. Industries such as communications, aerospace, retail, and financial services use the Splunk platform. Splunk also positions its products for use in higher education and healthcare.

Splunk offers a web user interface, known as Splunk Web, which is accessible through any browser. It also features a dizzying array of user guides, add-ons for other analytics platforms, and free trials.

What Are the Best Ways to Improve My Data Analytics Skills?

With so many tools, platforms, and languages to learn in data analytics, finding a place to start can be challenging. Which skills should you acquire to perform your current job more efficiently or pursue a new one? And how much time and money are you able to invest in this educational process?

You have several options to learn new data analytics tools, each of which can be the right path. Let’s explore three ways to improve your data analytics skills to determine which might be right for you.

Boot camps are short-term, intensive educational opportunities that provide practical skills and project experience in several technical fields.

A data analytics boot camp covers a lot of ground during its 24-week, part-time curriculum. Learners study relevant tools and technologies such as Excel, Python, JavaScript, HTML/CSS, Tableau, and more. These bootcamp curricula are market-tested to highlight the most in-demand skills in data analytics.

Boot camps can be effective for professionals seeking to advance their careers or make themselves marketable in a new field. The data analytics boot camp, for instance, requires no experience working with data or in computer programming, but candidates should have a bachelor’s degree and at least two years of work experience.

For professionals who work in business, finance, management, or similar fields, a boot camp can help them build technical skills to complement their other experience. And, since the boot camp is conducted online and part-time, learners have the flexibility to take classes while working. When they complete the course, learners move forward with a rich new skill set to wow potential employers.

Eighty percent of developers have completed at least a bachelor’s degree, according to Stack Overflow, underscoring the importance of a college degree in the technical fields. It remains the primary entry point to a career in data as CareerOneStop reports that 88 percent of data scientists hold a college degree and 50 percent have postgraduate degrees.

Professionals who are considering a return to school must weigh the commitments of time and cost against their goals. For some, pursuing a four-year degree is the right choice, since it provides a comprehensive education in data analytics, programming, and computer science. It can mark the beginning of a wholesale career change.

Others, meanwhile, might want to target their learning toward specific languages, platforms, and applications that will benefit them in their current roles. That’s where boot camps and independent learning can be valuable.

Each of the data analytics tools discussed here offers a wealth of resources and guides for beginners. Even those with little or no programming experience can tackle a new tool at their own pace.

The primary benefit of independent learning is choice. If your company uses Tableau or is transitioning to Hadoop, you can concentrate specifically on those disciplines in a short time at a low cost. Online courses and certifications are available for many of these tools, often at their host sites. Further, online communities are great places to ask questions and test your knowledge with experts or other like-minded learners.

Interested in upskilling with in-demand analytics tools to take your career to the next level?

Learn more about Columbia Engineering Data Analytics Boot Camp and change your career trajectory in 24 weeks.

Data Analytics FAQs

Python is considered one of the easier programming languages to learn, especially for beginners, since its syntax mirrors that of the English language. It requires attention to detail, particularly when debugging errors, but users can pick up the basic elements in a short time.

Hadoop, Microsoft Power BI, and Apache Spark are some of the leading tools to use in working with big data. MongoDB, a popular relational database, is another tool that many companies use to manage large amounts of data.

Microsoft Power BI and Tableau are among the most widely used business intelligence tools in the world. In addition, SAS makes a suite of business intelligence tools that rank highly in the Gartner Magic Quadrant for Analytics.

Tableau is a leading platform for data visualization and includes a desktop application, an online version, and even a free public option. Those who program with Python consider Matplotlib to be a necessary library for data visualization. JavaScript is another commonly used tool for data visualization.

Consider the data you’re analyzing, your business needs, and your skill and comfort with new technologies when choosing data analytics tools to learn. Are you working with databases? Do you need to build predictive models? What are your visualization requirements? These questions will help to inform your decision.

Python is considered a leading language for data analytics because it is object-oriented and has a readable syntax. Data analysts also benefit from the abundant collection of Python libraries that help simplify performing analytical operations and visualizing data.

Every business generates data, and data analytics tools help those businesses make sense of their data. By studying purchasing habits, click-through rates, or historical trends, businesses can turn data into actionable insight and decisions that will drive their futures.

Learn More About Data Analytics

Data shapes nearly every corner of our world, and businesses are investing more money and employee resources into analytics. To be competitive, businesses must be data savvy; that also applies to the workforce. Make yourself stand out to top employers by learning how to use some of the key data analytics tools. Learn more about the in-demand skills that can take you places at Columbia Engineering Data Analytics Boot Camp.

Get Boot Camp Info

Back
Back
Back
Back
Back
Back
Back
Back
Back
0%

Step 1 of 6