10 Advanced Excel Skills You Need to Succeed Today

Excel is an important, in-demand skill in countless industries. Advanced Excel skills include the ability to produce graphs and tables, use spreadsheets efficiently, and perform calculations and automation to process large volumes of data. With the rise of big data and data analytics, advanced Excel skills are a real asset both during the job hunt and everyday work tasks. 

Whether you are considering a career in data analytics or looking to enhance your skills on the job, Excel training can be valuable in preparing you for a variety of promising roles.

Advanced Excel Topics

Below, we will address some of the top 10 Excel skills needed to break into the data analytics industry — as well as effective ways to learn these skills. The Columbia Engineering Data Analytics Boot Camp curriculum, for instance, can be a great way to hone your Excel skills; the data analytics boot camp covers intermediate Excel topics, which form the foundation for the following advanced Excel skills.

Excel Skill 1: Statistical Modeling

Excel provides a specialized toolkit enabling you to perform statistical modeling inside the popular spreadsheet program. These kinds of diverse applications are exactly why Excel skills remain important in the job market. The advanced Excel formulas involved in producing statistical models and performing advanced data analytics enable you to perform meaningful statistical analysis and produce useful models. 

Excel’s statistical modeling functions include tools to create histograms, generate random numbers, find correlations between data sets, measure for rank and percentile, perform regression, and assess sampling. Using Excel to perform statistical modeling can reduce human errors sometimes involved in statistical analysis.

If you have only used Excel for basic budgeting or project management, you may be unaware of the statistical tools that can power up your Excel skills. While some of the advanced Excel tools for statistical modeling are built into the program’s basic functions, others are part of the add-on package for data analysis. Through Excel’s Data tab, you can add in the Analysis ToolPak to gain access to these important functions.

Excel Skill 2: Forecasting and Prediction

If you have historical and time-based data, you can use advanced Excel functions to create forecasts and predictions of future performance. You can create this data at higher and lower confidence levels for different degrees of probability — this can be important for businesses aiming to predict stock trajectories, forecast the growth of their sales efforts, or understand changes in the economy.

Excel’s Data tab has a substantial amount of advanced tools available for users, and Columbia Engineering Data Analytics Boot Camp can help you understand and make use of these more advanced functions. For example, if you’re working with two corresponding data series, you can insert a Forecast Sheet under the Data tab to create line or column charts with the relevant forecast. You can set your own end date for the forecast and choose from a number of options to fine-tune your results, including filling in missing points and assessing for seasonality.

Excel Skill 3: Pivot Tables

Pivot tables are perhaps one of the best-known and more powerful advanced Excel skills, as they can automatically give you quick summaries of the data in a massive Excel spreadsheet by grouping matching data. For example, pivot tables can quickly graph sales data by product, financial performance by investment type, or weight of various items in inventory. These tables, launched from the Tables section of the Insert tab, can be used to count, sort, total, or average data taken from one large spreadsheet.

With pivot tables, you may eliminate the need for individual formulas in producing meaningful data analysis — one of the most important Excel skills for employers because of its versatility and efficiency. After you have mastered these advanced Excel functions, you can create a pivot table in less than a minute, whether you have only a few rows of data or thousands of rows of information. You can create the specific fields to be addressed in the table, remove duplicates, count entries and provide a range of assessments of your data. Excel even includes recommended Pivot Tables keyed to the types of data presented in your spreadsheet.

Excel Skill 4: VBA and Macros

Visual Basic for Applications in Office (VBA) is a powerful, simple programming language created by Microsoft to extend and automate the capabilities of Excel and other Office software. VBA can be used to automate any function that you can perform in Excel and enables you to save the resulting code as a macro to be used repeatedly, which can dramatically ramp up efficiency and output when you have repetitive tasks or need to clean data across a range of spreadsheets.

Creating and applying macros can result in cutting a task down from days to hours, allowing you and your employer to save time. VBA programming allows you to have total control over the macros you produce — not only to automate advanced Excel functions but to create unique dialog boxes and other options for your particular business case.

Excel Skill 5: Model Historic Stock Trends

Excel offers a stock data type created specifically to pull in present and historical stock performance data. By modeling variations of a stock and the instruments based on it, like derivatives, you can receive a representation of the stock’s valuation at present and over time. By using the stock data type, you can bring in existing prices as well as the company name, number of employees, and other key data that can be used to perform stock modeling.

The advanced Excel function STOCKHISTORY provides access to historical data that can be formatted dynamically. By using the stocks data type and pulling in the start and end date (as well as specified properties), Excel users can pull in data over time on a specific exchange, in a certain currency, and with other specifications. This information may produce graphical representations of a particular stock’s history — as well as forecasting and prediction models to assess potential future outcomes.

Advanced Excel Skills for Your Resume

  • Statistical Modeling
  • Forecasting and Prediction
  • Pivot Tables
  • VBA and Macros
  • Model Historic Stock Trends

Advanced Excel Formulas

There are a myriad of advanced Excel formulas — many of which enable you to quickly and effectively perform key tasks on the job. These advanced formulas often provide advanced automation or searching capabilities, which can save time and produce quick, efficient results. 

The following are a few such formulas that may be covered at a data analytics boot camp

Sum If

The SUMIF formula is used to add cells together when they share certain properties. For example, SUMIF can be used when those data cells have a certain number or word attached to them, indicating, for instance, a certain class or type of product. It can also be used to add information that is above or below a certain value — or that equates to a particular amount — highlighting outliers or grouping together certain kinds of information.

SUMIF is a useful formula to gather summary information about sales, enrollment, or other total figures for large data sets that encompass different types of information. The SUMIF formula takes in data including the range of cells to examine, the criteria to determine which cells should be added together, and the sum range to add together.

Conditional Formatting

In many industries, formatted Excel tables and spreadsheets are important to provide a visual representation of your data. After you’ve crunched the numbers, you need to present your information to others at your employer. In many cases, making the key data and takeaways stand out is critical to effective business communication and ensuring that your presentation is understood by listeners and readers.

Conditional formatting changes the color and appearance of a cell and its contents based on certain conditions about the type of information it contains. For example, in a financial or budgeting spreadsheet, you may want negative numbers to be highlighted in red. You may want to highlight any divergent information in yellow if they contain a certain word or error code.

By determining the type of information you want to highlight, Excel skills in conditional formatting can enable you to deliver your information visually as well as verbally. You can highlight top performers or areas that need improvement with just a few clicks and color changes.

If Error

Sometimes, you may encounter errors when performing advanced Excel functions. This may be for a number of reasons, including the absence of a certain type of data in particular rows, or it may indicate a problem that needs to be fixed. IFERROR is used to remove error codes and produce either a blank cell or a text you specify that indicates that the cell or area needs further review or attention.

However, Excel by default produces certain types of error codes that can stop calculations from running across a range of values while also presenting a disruptive, attention-grabbing appearance on the sheet for easy identification and correction.

Count If

The COUNTIF function in Excel is used to count cells that have certain properties. If you want to find out how many times a certain word or entry appears in a large spreadsheet, COUNTIF examines all of your data and produces a count of the criteria that you specify. This can be very important whenever you want to know the number of things that are labeled in a particular way. Whether you want to understand the distribution of your inventory, identify where your customers are located, or determine the number of employees in a particular department, COUNTIF enables you to get this information quickly by taking in the range of cells you wish to examine as well as the criteria you are using to search.

Index Match

The combination of the INDEX and MATCH functions in Excel provides a more advanced way to look up and assess information inside an Excel sheet or workbook. While functions like VLOOKUP and HLOOKUP allow you to search for information, they have limitations on where and how they search that can prevent you from easily obtaining the information you need. The MATCH function is nested inside the INDEX function and can be used to find a certain type of data, while INDEX is used to connect that information to the other data available in its row.

In other words, MATCH allows you to find the position of a value in a range, and then INDEX is used to return a specific value in relation to the original value. It is important for two-way lookups and case-sensitive lookups, and you can even use it to find the closest match from the data you have.

How to Learn Excel

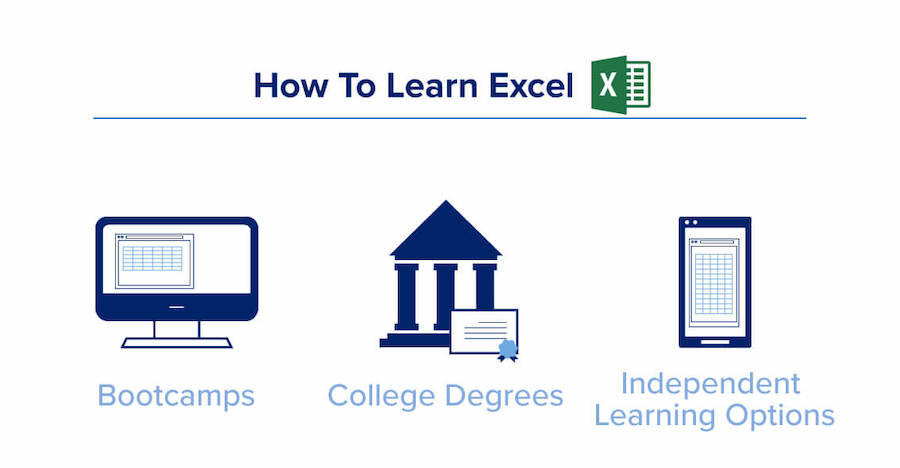
There are a number of ways to learn advanced Excel skills. Your ideal learning model will likely depend on your professional timeline, your developmental needs, and your existing knowledge. For instance, those seeking a more systematic approach to learning Excel may pursue a data analytics bootcamp, a relevant college degree, or an applicable independent learning option. 

Bootcamps

There are many advantages to learning Excel skills through a tech bootcamp. For one, most data analytics bootcamps provide a well-developed curriculum delivered by knowledgeable instructors, positioning you to pursue an exciting new job in the field. 

Often, you are able to choose a full- or part-time course, giving you the option to learn while working or pursuing other endeavors. Bootcamps are generally predicated on practical, project-based learning that simulates real-world scenarios and teaches key skills quickly yet effectively. These courses also cater to a variety of prior skill levels. Columbia Engineering Data Analytics Boot Camp, for example, begins with intermediate Excel skills that you can build upon for advanced Excel knowledge. Bootcamps often provide a balance for learners, as they offer a healthy blend of high-level accountability and support.

Ready to advance your career? Consider learning Excel at Columbia Engineering Data Analytics Boot Camp.

Get Boot Camp Info

Back
Back
Back
Back
Back
Back
Back
Back
Back
0%

Step 1 of 6

College Degrees

College degrees, such as those in business administration or data analysis, can also provide key Excel skills and advanced training. They may provide a thorough understanding of the skills you need as well as extensive projects for practice, however, they may also have more of a theoretical focus than the practical focus covered in many tech boot camps. They may also require many years of work and greater expense to achieve your goal. If you already have an undergraduate degree, you may not want to repeat the same work again when you just need some additional training.

Independent Learning Options

Those interested in fully autonomous learning may master Excel through independent learning resources. These options include (but are not limited to) free online courses, comprehensive videos, and educational apps. Such resources give learners full self-accountability in learning Excel, offering the chance to learn hard technical skills while also honing soft skills like time management and assignment compartmentalization. 

Chat showing different options for learning excel: bootcamps, college, and independent learning options

Why Excel Skills Are Important in the Job Market

Excel is an important skill in countless roles. These skills are often necessary for success in many industries, and employers are likely to request advanced Excel skills when hiring for a data analytics profession. The data analytics industry is on the rise, so if you are wondering how to become a data analyst, Excel skills are one key way to achieve your goal.

Of course, data analysts are not the only profession that makes use of advanced Excel skills. These skills are key to a wide range of jobs, including:

  • Finance and accounting
  • Human resources
  • Digital marketing
  • Project management
  • Inventory and product management

Begin Your Advanced Excel Training Today

There is great demand for Excel proficiency in today’s job market. With the demand from employers, it is important to have the advanced Excel skills that are in high demand for tech roles and other fast-growing industries. A data bootcamp is one great way to get the skills you need. To begin your journey to advanced Excel training today, find out more about how Columbia Engineering Data Analytics Boot Camp can empower your path to data analysis success.

Get Boot Camp Info

Back
Back
Back
Back
Back
Back
Back
Back
Back
0%

Step 1 of 6